
Graph of a Cubic Function: Complete Guide with Examples
Master graphing cubic functions! Learn how to find intercepts, turning points, and inflection points. Includes 15 graphing examples and a step-by-step guide.
Introduction
Algebra often feels like a series of abstract rules and formulas until you plot it on a grid. Once you graph an equation, the numbers suddenly transform into a physical shape. When it comes to the graph of a cubic function, that shape is one of the most elegant and recognizable curves in all of mathematics: the classic “S-curve.”
What is a cubic function? It is a mathematical relationship where the highest power of the input variable is 3 (e.g., ). Because cubing a negative number yields a massive negative result, and cubing a positive number yields a massive positive result, the graph spans from the absolute depths of the Cartesian plane to its highest peaks.
Why is graphing important? Graphing a cubic function isn’t just a classroom exercise. It is the visual translation of the equation’s DNA. A single glance at a cubic graph instantly reveals how many real solutions (roots) the equation has, where the function reaches its peak efficiency, and how fast it grows.
Applications of cubic graphs: Engineers use these graphs to model fluid dynamics, economists use them to plot production costs, and computer animators use them to program smooth, curving movements for 3D characters.
What readers will learn: In this definitive guide, you will master the art of graphing cubic functions. We will break down every characteristic of the graph—from end behavior and turning points to the unique inflection point. You will learn a step-by-step method to sketch these graphs entirely by hand, explore how coefficients warp and shift the curve, and test your skills with 15 fully solved graphing examples and 30 practice problems.
What Is a Cubic Function?
To graph a function, we must first understand the equation that generates it.
A cubic function is a polynomial function of degree 3. It takes an input (), manipulates it using a highest power of 3, and produces an output ( or ).
The General Form
The general, standard form of a cubic function is written as:
Let us break down each coefficient and its role in generating the graph:
- (Leading Coefficient): The most powerful number in the equation. It dictates the “end behavior” (which way the extreme left and right sides of the graph point) and the width of the curve. It cannot equal zero ().
- (Quadratic Coefficient): Working together with and , this coefficient helps determine where the peaks and valleys (turning points) will be located.
- (Linear Coefficient): This influences the slope of the curve exactly as it crosses the vertical y-axis.
- (Constant Term): The number standing alone. It is the exact y-coordinate where the graph crosses the y-axis.
Relationship Between Equations and Graphs
An equation and its graph are two sides of the exact same coin. If you plug into the equation and the math outputs , it means the graph physically passes through the coordinate point . By finding the most important points (intercepts and peaks), we can “connect the dots” to reveal the full shape.
Characteristics of a Cubic Graph
Before putting pencil to paper, you should know what a cubic graph is supposed to look like. All cubic graphs share these fundamental characteristics:
- Degree: 3. This odd degree is what gives the graph its defining opposite-facing end behavior.
- Shape: The graph generally forms an “S” shape or a reverse-”S” shape. Occasionally, it can look like a slightly warped, flattened slide.
- Continuity: The domain and range of every standard cubic function are all real numbers . The graph is a single, continuous, unbroken curve. There are no holes, gaps, or vertical asymptotes.
- Maximum Turning Points: The graph can turn around a maximum of two times (creating one peak and one valley). However, it is also possible for it to have zero turning points. It can never have exactly one.
- Inflection Point: The exact center of the curve where it stops bending downward and starts bending upward (or vice versa). Every single cubic graph has exactly one point of inflection.
- End Behavior: The two arrows at the far ends of the graph will always point in opposite vertical directions.
- Odd Symmetry in Special Cases: The “parent” function has perfect point symmetry around the origin . This is called an “odd function” ().
How to Graph a Cubic Function
Graphing a cubic function by hand requires a systematic approach. Do not just plug in random numbers! Use the following step-by-step process.
Step 1: Identify the leading coefficient ()
Look at the number attached to .
- If is positive, sketch a quick mental image: the graph will start bottom-left and end top-right.
- If is negative, it will start top-left and end bottom-right.
Step 2: Find the y-intercept
This is the easiest point to find. Set . In standard form (), all the terms turn to zero. The y-intercept is always . Plot this dot on the y-axis.
Step 3: Find possible x-intercepts (Roots)
Set to find where the graph crosses the horizontal x-axis.
- Try to factor the equation by grouping.
- If it doesn’t group, use the Rational Root Theorem and synthetic division.
- You will find 1, 2, or 3 real roots. Plot these dots on the x-axis.
Step 4: Locate turning points (Optional but highly recommended)
To find the exact coordinates of the peaks and valleys, you need basic calculus. Take the first derivative , set it equal to 0, and solve the quadratic equation. The resulting values are where the graph turns around. Plug those values back into the original equation to find their heights, and plot them.
Step 5: Find the inflection point
The x-coordinate of the inflection point is always located at . Plug this value into the original equation to find the coordinate. Plot this point.
Step 6: Sketch the curve
Connect your points! Start from the correct end behavior, draw a smooth curve passing through your x-intercepts, hitting your turning points, crossing the y-intercept, passing perfectly through your inflection point, and exiting toward the opposite end behavior.
Step 7: Verify using technology
Always double-check your hand-drawn sketch by typing the equation into a graphing calculator, Desmos, or our cubic equation solver.
Understanding End Behavior
End behavior describes what the -values do as gets extremely large in the positive or negative direction. It is entirely controlled by the leading coefficient, .
Positive Leading Coefficient ()
Because a positive number cubed remains positive, and a negative number cubed remains negative, the graph matches the sign of at infinity.
- As , (Right side points UP).
- As , (Left side points DOWN).
Negative Leading Coefficient ()
The negative reverses everything. Cubing a massive negative number gives a negative result, but multiplying it by a negative flips it to a massive positive.
- As , (Right side points DOWN).
- As , (Left side points UP).
End Behavior Comparison Table
| Coefficient | Left Side of Graph | Right Side of Graph | Visual Shape |
|---|---|---|---|
| Points Down () | Points Up () | (Bottom-left to Top-right) | |
| Points Up () | Points Down () | (Top-left to Bottom-right) |
X-Intercepts and Roots
The x-intercepts are the exact coordinates where the graph crosses the horizontal x-axis. Algebraically, these are the “roots” or “zeros” of the equation (where ). Because it is a degree 3 polynomial, the graph can interact with the x-axis in three distinct ways.
1. Three Real Roots (Crosses 3 times)
If the equation factors into three distinct binomials, e.g., , the graph will cross the x-axis exactly three times. It will weave above and below the axis like a snake.
2. One Real Root (Crosses 1 time)
Every cubic graph must cross the x-axis at least once because its ends go in opposite directions. If it only crosses once, the other two mathematical roots are “complex numbers” involving , which do not appear on a standard real Cartesian plane.
3. Repeated Roots (Multiplicity)
Sometimes an equation has the same root multiple times. This dramatically alters how the graph interacts with the axis.
- Multiplicity of 2 (Double Root): e.g., . The graph crosses normally at , but at , it just touches the axis and bounces back in the direction it came from. The root is perfectly aligned with a turning point.
- Multiplicity of 3 (Triple Root): e.g., . The graph passes through the axis at , but it flattens out perfectly horizontally for a microsecond as it crosses.
Y-Intercept
The y-intercept is where the curve crosses the vertical y-axis. A function can only cross the y-axis exactly one time.
How to calculate and interpret
To find it, you set . In the equation :
The y-intercept is the point .
Shortcut: The y-intercept of any polynomial in standard form is always . It acts as a perfect “anchor point” for your sketch.
Turning Points
A turning point is a peak or a valley. It is where the graph stops increasing and starts decreasing, or vice versa.
Local Maximum and Local Minimum
- Local Maximum: The peak of a “hill” on the graph. It is the highest y-value in its immediate local area.
- Local Minimum: The bottom of a “valley.” It is the lowest y-value in its immediate area.
Maximum possible turning points
A polynomial of degree can have at most turning points. Therefore, a cubic graph (degree 3) can have a maximum of 2 turning points. It can also have zero.
Relationship with derivatives
To find the exact coordinates of these peaks without graphing software, you use Calculus. The derivative of a function gives you its slope. At a peak or valley, the curve is perfectly flat, meaning the slope is exactly 0. If , the derivative is . Setting gives and . These are the x-coordinates of your turning points!
Inflection Point
The inflection point is the most unique architectural feature of a cubic graph.
Define the inflection point
It is the exact center point of the graph where the curvature changes. If the graph was curving downward (concave down, like a frown), the inflection point is where it smoothly transitions to curving upward (concave up, like a smile).
Why every cubic function has one
Because the graph’s ends go in opposite directions, it must eventually twist to face the other way. Mathematically, the second derivative of a cubic equation is a linear equation (). A linear equation always crosses zero exactly once, meaning there is exactly one change in concavity.
How to find it
You can find the x-coordinate of the inflection point without calculus using a simple formula derived from the coefficients: Once you have , plug it back into the original equation to find the coordinate.
Worked Example: Find the inflection point of .
- .
- Plug into the equation: . The inflection point is precisely at .
How Coefficients Affect the Graph
If you use a graphing slider online and change the values of , and , the graph dances around the screen. Here is what each coefficient does physically.
Leading coefficient ()
- Sign: Flips the entire graph upside down (changes end behavior).
- Magnitude: A large number () stretches the graph vertically, making the “S” look very tall and skinny. A small fraction () compresses it, making it look like a wide, slow-rolling wave.
Constant term ()
Changing physically lifts the entire graph straight up or shifts it straight down on the y-axis, without altering its shape or “wiggle” whatsoever.
Quadratic and Linear coefficients ( and )
These two work together to shape the middle of the graph. Changing them shifts the x-coordinate of the inflection point () and can stretch or compress the distance between the two turning points. If and are zero (), the graph has no peaks or valleys at all.
Transformations of Cubic Functions
Instead of expanding complex polynomials, we can graph functions by moving the basic “parent function” around the grid using transformation rules. The transformation format is:
Vertical Shifts
The number at the end shifts the graph up or down.
- shifts the entire graph UP 4 units.
- shifts the entire graph DOWN 2 units.
Horizontal Shifts
The number inside the parentheses shifts the graph left or right. It is counter-intuitive (it does the opposite of the sign).
- shifts the graph RIGHT 3 units.
- shifts the graph LEFT 5 units.
Reflections
A negative sign on the outside flips the graph vertically over the x-axis.
- flips the graph upside down.
Stretches and Compressions
A multiplier on the outside stretches or compresses the graph.
- represents a vertical stretch (it grows 4 times faster).
Worked Example: Describe the graph of . It is the standard cubic graph, flipped upside down (negative), stretched vertically by a factor of 2, shifted Right 1 unit, and shifted Up 3 units. Its new inflection point sits at .
Comparing Cubic and Quadratic Graphs
To understand higher-degree polynomials, it helps to compare them to familiar ones.
| Feature | Quadratic Graph () | Cubic Graph () |
|---|---|---|
| Shape | Parabola (U-Shape). | Cubic Curve (S-Shape). |
| Degree | 2 (Even). | 3 (Odd). |
| End Behavior | Both ends point the same direction (Both Up or Both Down). | Ends point in opposite directions. |
| Turning Points | Exactly 1 (The vertex). | 0 or 2. |
| Inflection Point | None (It never changes concavity). | Exactly 1. |
| Guaranteed Real Roots? | No. It can float entirely above the axis. | Yes. It must cross the axis at least once. |
| Applications | Gravity, projectile motion, satellite dishes. | Fluid dynamics, cost-curves, 3D splines. |
Graphing Using Technology
While drawing by hand builds deep mathematical understanding, modern technology is required for complex, real-world equations.
- Online Graphing Calculators: Websites like Desmos or GeoGebra are the gold standard. You simply type and it instantly renders an interactive graph where you can click on roots and turning points to see their exact decimal coordinates.
- Cubic Equation Solvers: You can use specialized online cubic equation solvers to instantly calculate the exact irrational or complex roots, which takes the guesswork out of finding x-intercepts for graphing.
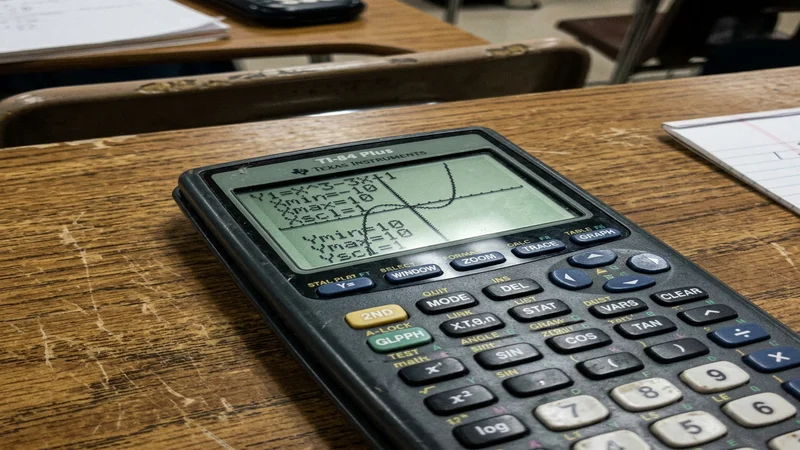
- Scientific/Graphing Calculators: Devices like the TI-84 Plus allow you to input equations into the “Y=” screen, view the graph, and use the “CALC” menu to automatically find “Zeros”, “Minimums”, and “Maximums.”
- Spreadsheet Software: You can use Excel or Google Sheets by creating a column of x-values (e.g., -5 to 5), calculating the y-values in the next column, and inserting a “Scatter Plot with Smooth Lines.”
Real World Applications
Why do professionals analyze cubic graphs? Because interpreting the peaks and valleys supports multi-million dollar decision-making.
- Economics (Cost Curves): A company’s Short-Run Total Cost curve is usually a cubic graph. The inflection point on this graph represents the exact moment of maximum production efficiency before the factory becomes too crowded and costs begin to rise sharply again.
- Engineering (Beam Deflection): When structural engineers calculate how much a steel beam will bend under a load, the physical curve of the bent beam matches the graph of a cubic polynomial.
- Computer Graphics (Bezier Curves): Every time you use the “pen tool” in Photoshop or Illustrator to draw a smooth curve, the software is generating a parametric cubic graph in the background to ensure the line bends organically without sharp, robotic angles.
- Physics: The thermodynamic Van der Waals equation, which models how real gases behave, generates a cubic graph where the turning points represent critical transition phases between liquid and gas states.
Common Mistakes When Graphing
Avoid these frequent pitfalls when sketching by hand:
- Incorrect End Behavior: Forgetting to check the sign of the leading coefficient. Drawing a graph pointing top-right when the leading coefficient is actually negative.
- Missing Turning Points: Assuming that finding three roots is enough. If you don’t calculate turning points, you might draw the peaks way too high or way too low.
- Misinterpreting Roots: Finding complex roots (like ) and trying to plot them on the x-axis. Complex roots cannot be graphed on a standard 2D real plane; the graph simply won’t cross the axis there.
- Ignoring Multiplicity: Finding a double root like and drawing the line straight through it, instead of bouncing off the axis.
- Poor Scaling: Picking random x-values (-10, 0, 10) to plot points. Because it is , . The graph will shoot off the paper immediately. Pick x-values close to the origin.
Worked Examples
Let’s walk through 15 complete graphing scenarios, applying everything we have learned.
Example 1: Graphing the Parent Function
Equation:
Steps: Positive leading coefficient (Starts low, ends high). Y-intercept is 0. Root is (triple root, meaning it flattens).
Graph: A smooth curve passing through (-1, -1), flattening perfectly at (0,0), and passing through (1, 1).
Example 2: A simple vertical shift
Equation:
Steps: This is the parent function shifted down 8 units. The y-intercept is . Set : . The x-intercept is .
Graph: Starts low, crosses y at -8, crosses x at 2, ends high.
Example 3: Factored Form (3 real roots)
Equation:
Steps: Roots are instantly visible: . Y-intercept (plug in 0): . Leading term is , so end behavior is down/up.
Graph: Starts bottom left, crosses up through -3, hits peak, crosses down at y=12, crosses x-axis at 1, hits valley, crosses up through 4, ends top right.
Example 4: A Negative Factored Form
Equation:
Steps: Roots: . Y-intercept: . End behavior is reversed because of the negative sign (starts top left, ends bottom right).
Graph: Comes from top left, crosses down at -2, hits valley, crosses y at -20, crosses up at 2, hits peak, crosses down at 5.
Example 5: Repeated Root (Bounce)
Equation:
Steps: Roots: (multiplicity 2, bounce), (crosses). Y-intercept: . Leading coefficient positive.
Graph: Starts bottom left, goes up to touch axis at , bounces straight back down to cross y at -12, hits valley, goes up to cross axis at 3.
Example 6: Finding the Inflection Point
Equation:
Steps: Use . .
Plug 2 in: .
Inflection Point: The exact center of the curve is at .
Example 7: Graphing from Standard Form (Grouping)
Equation:
Steps: Y-int is . Set to find roots. Factor by grouping: . Roots are .
Graph: Standard S-curve passing through x-axis at -2, 1, and 2, and crossing the y-axis at 4.
Example 8: Only One Real Root
Equation:
Steps: Y-int is . Use rational root theorem: works. Synthetic division yields , which has complex roots.
Graph: The curve starts low, crosses y at -10, crosses x exactly once at 2, and points up. It has no turning points, just a slight wiggle.
Example 9: Transformations
Equation:
Steps: This is the parent function , flipped upside down, compressed to be twice as wide, shifted right 4, and up 2.
Graph: The inflection point is strictly located at . It slopes downward.
Example 10: Missing terms
Equation:
Steps: Y-int is . Factor out x: . Roots at .
Graph: Perfectly symmetrical S-curve crossing through origin and .
Example 11: Turning points via Calculus
Equation:
Steps: Derivative is . Turning points at and .
Plug back in: At (Peak). At (Valley).
Example 12: Graphing a Depressed Cubic
Equation:
Steps: Because , the inflection point is . The inflection point sits perfectly on the y-axis at .
Example 13: Interpreting a given graph
Problem: A graph has roots at -4, 0, and 5. It passes through (1, 10). Find the equation.
Steps: Base format .
Plug in (1, 10): .
Equation: .
Example 14: Perfect Cube expansion
Equation:
Steps: Recognizable as . It is a standard shifted cubic curve.
Graph: Flattens out perfectly as it crosses the x-axis at .
Example 15: Purely numerical plotting
Equation:
Steps: If stuck, make a T-chart.
Plot points and connect with a smooth curve.
Practice Problems
Test your graphing knowledge. Solutions are located below.
Beginner Level
- What is the y-intercept of ?
- Does point up or down on the far right side of the graph?
- How many x-intercepts does have?
- What is the inflection point of ?
- True or False: Every cubic graph must cross the x-axis at least once.
- Does cross or bounce at ?
- What is the degree of ?
- Where is the inflection point of ?
- What happens to the parent graph if the equation is ?
- Describe the end behavior of .
Intermediate Level
- Find the x-intercepts of .
- Find the y-intercept of .
- Calculate the x-coordinate of the inflection point for .
- Write a cubic equation in factored form with roots at and , and .
- A graph starts top-left and ends bottom-right. Is the leading coefficient positive or negative?
- Find the turning points of using calculus/derivatives.
- Sketch a mental graph of . Where does it cross the axes?
- Factor and find the roots of .
- Does have any turning points? (Hint: look at the derivative).
- Find the y-intercept of .
Advanced Level
- Find the exact coordinate of the inflection point for .
- A cubic graph touches the x-axis at and crosses at . Its y-intercept is -36. Write the equation.
- Find the x-intercepts of .
- Prove algebraically that always has an inflection point at .
- Find the peaks and valleys of .
- If is translated left 2 units and down 5, what is the new equation for ?
- Describe the symmetry of .
- At what point does cross the x-axis? Does it have turning points?
- Create a cubic equation that has exactly ONE real root and passes through .
- If a depressed cubic has , will it cross the x-axis 1, 2, or 3 times?
Solutions to Practice Problems
Beginner Solutions:- Down (Negative leading coefficient).
- 3 intercepts ().
- True.
- It bounces (touches and turns around).
- Degree 3.
- It undergoes a vertical stretch (becomes steeper/narrower).
- As . As .
Intermediate Solutions: 11. . 12. Plug in : . The intercept is . 13. . 14. . 15. Negative. 16. . At . At . 17. Crosses y-axis at , crosses x-axis at . 18. . Roots: . 19. . No real solutions for derivative, so ZERO turning points. 20. Plug in 0: .
Advanced Solutions: 21. . Plug in 1: . Point is . 22. Touches = multiplicity 2. . Plug in : . Equation: . 23. Roots of 6. Test . Synthetic div yields . Roots are . 24. Inflection point occurs where 2nd derivative is 0. . . Set to 0: . 25. . Peaks/valleys at and . 26. . 27. It is an odd function. It has perfect point symmetry around the origin . 28. Crosses at . It has 0 turning points. 29. Many answers. Example: (Crosses at ). 30. Exactly 1 time. The derivative is always positive, meaning it never turns around.
Frequently Asked Questions
What is the graph of a cubic function?
It is a continuous, unbroken curve on a coordinate plane that represents a third-degree polynomial. It typically has a distinctive “S” or reverse-”S” shape.
What shape does a cubic graph have?
It has an S-curve shape that extends infinitely in opposite vertical directions.
How many turning points can a cubic graph have?
It can have a maximum of two turning points (one peak and one valley). It can also have zero turning points if it slopes constantly in one direction.
How many inflection points does a cubic graph have?
Exactly one. Every cubic graph has a single center point where the concavity perfectly reverses.
How do you graph a cubic function?
Find the y-intercept, find the x-intercepts (roots), determine the end behavior using the leading coefficient, find the turning points using calculus or estimation, and sketch a smooth curve connecting them.
How do roots affect the graph?
Roots are the exact locations where the graph crosses the horizontal x-axis.
Why does every cubic function have an inflection point?
Because the two ends of the graph must point in opposite directions, the curve is mathematically forced to bend and change its concavity at least once to achieve those opposing directions.
What happens if the leading coefficient is negative?
The entire graph flips vertically. Instead of starting low and ending high, the graph will start high (top-left) and plunge downward (bottom-right).
Can a cubic graph cross the x-axis three times?
Yes. If the equation has three distinct real roots, the graph will weave back and forth, crossing the axis exactly three times.
What is the difference between cubic and quadratic graphs?
A quadratic graph () is a U-shaped parabola where both ends point the same way. A cubic graph () is an S-curve where the ends point in opposite directions.
What does a double root look like on a graph?
A double root acts like a wall. The curve touches the x-axis at that specific point, but instead of crossing through, it bounces back in the direction it came from.
How do you find the y-intercept?
Set in the equation. In standard form (), the y-intercept is always the constant number .
Does shifting a graph change its shape?
No. Adding a constant (like ) simply slides the existing curve up or down the grid like a puzzle piece. It doesn’t stretch or warp the S-curve.
What causes the graph to stretch vertically?
Multiplying the leading by a whole number (like 4 or 10) causes the y-values to grow exponentially faster, making the graph look vertically stretched or narrower.
Can you find the inflection point without calculus?
Yes. For any standard cubic function, the x-coordinate of the inflection point is always .
Why do economists use cubic graphs?
Because the S-curve perfectly models the reality of manufacturing costs: costs rise initially, flatten out as maximum efficiency is reached, and then rise steeply again when facilities are over-capacity.
Do I have to use a graphing calculator?
While you can graph by hand using intercepts and logic, graphing calculators are highly recommended for finding complex decimal turning points instantly.
What if the equation is missing the x and x^2 terms?
If the equation is simply , the graph is a perfectly symmetrical slide that passes through the y-intercept without creating any distinct peaks or valleys.
Are inflection points and turning points the same thing?
No. Turning points are the absolute highest/lowest local peaks. The inflection point is the halfway mark directly between those two peaks.
Can a cubic graph be a straight line?
No. Even if the graph lacks distinct peaks and valleys, the exponent guarantees that the curve will eventually bend and accelerate dramatically toward infinity.
Summary
The graph of a cubic function is one of the most expressive and mathematically rich visual tools in algebra. By translating the standard equation onto a Cartesian plane, you unlock a visual representation of the function’s deepest secrets.
Remember the golden rules of cubic graphing:
- The leading coefficient () determines whether the S-curve starts low and ends high, or starts high and ends low.
- The constant () locks in your y-intercept.
- The roots dictate where the curve intersects or bounces off the x-axis.
- Every single cubic curve possesses exactly one central inflection point ().
Whether you are sketching a graph by hand for a high school math test or using a graphing calculator to analyze a thermodynamic physics model, you now have the step-by-step roadmap to interpret and draw any cubic function.
Continue your mathematical journey with our related guides:
- What Is a Cubic Equation? Basic Fundamentals
- Standard Form of a Cubic Equation
- Types of Cubic Equations Explained
- Real vs Complex Roots on a Graph
- How to Solve Cubic Equations: Step-by-Step
- Understanding Cardano’s Method
- Cubic vs Quadratic Equations: The Core Differences
- Factoring Cubic Equations: The Complete Guide
- Mastering the Rational Root Theorem